


Fast Delivery
Multiple courier options
Rs.419
Rs. 599
30% OFF
Inclusive all taxes
This Product is out of stock
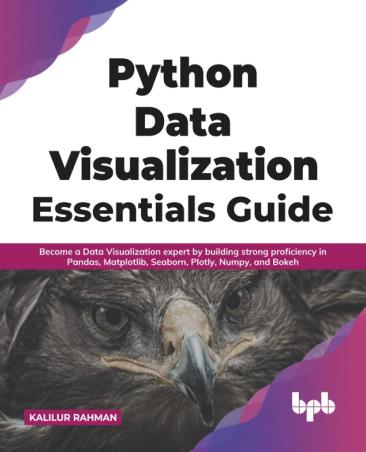
Data visualization plays a major role in solving data science challenges with various capabilities it gives. This book aims to equip you with a sound knowledge of Python in conjunction with the concepts you need to master to succeed as a data visualization expert. The book starts with a brief introduction to the world of data visualization and talks about why it is important, the history of visualization, and the capabilities it offers. You will learn how to do simple Python-based visualization with examples with progressive complexity of key features. The book starts with Matplotlib and explores the power of data visualization with over 50 examples. It then explores the power of data visualization using one of the popular exploratory data analysis-oriented libraries, Pandas. The book talks about statistically inclined data visualization libraries such as Seaborn. The book also teaches how we can leverage bokeh and Plotly for interactive data visualization. Each chapter is enriched and loaded with 30+ examples that will guide you in learning everything about data visualization and storytelling of mixed datasets.
| Author | Kalilur Rahman |
| Publisher | BPB Publications |
| Language | English |
| Binding Type | Paper Back |
| Main Category | Science & Mathematics |
| Sub Category | Computer Science & Application |
| ISBN13 | 9789391030070 |
| SKU | BK 0114113 |
Rs. 399
Rs. 339
15% OFF
Rs. 699
Rs. 559
20% OFF
Multiple courier options
Within 15 Days
100% Secure Payment
Within 1 Business Day
We offers a vast range of e-books, from bestsellers to classics, providing an easy-to-use platform for all readers.
© Copyright 2025 | Logic Soft All Rights Reserved